Where it came from
French engineering professor Maximilien Ringelmann developed the chart in the 1880s to grade smoke from boilers. It was in use in the United States by 1897, and the U.S. Bureau of Mines later published the standard printed version.
The 0 to 5 scale
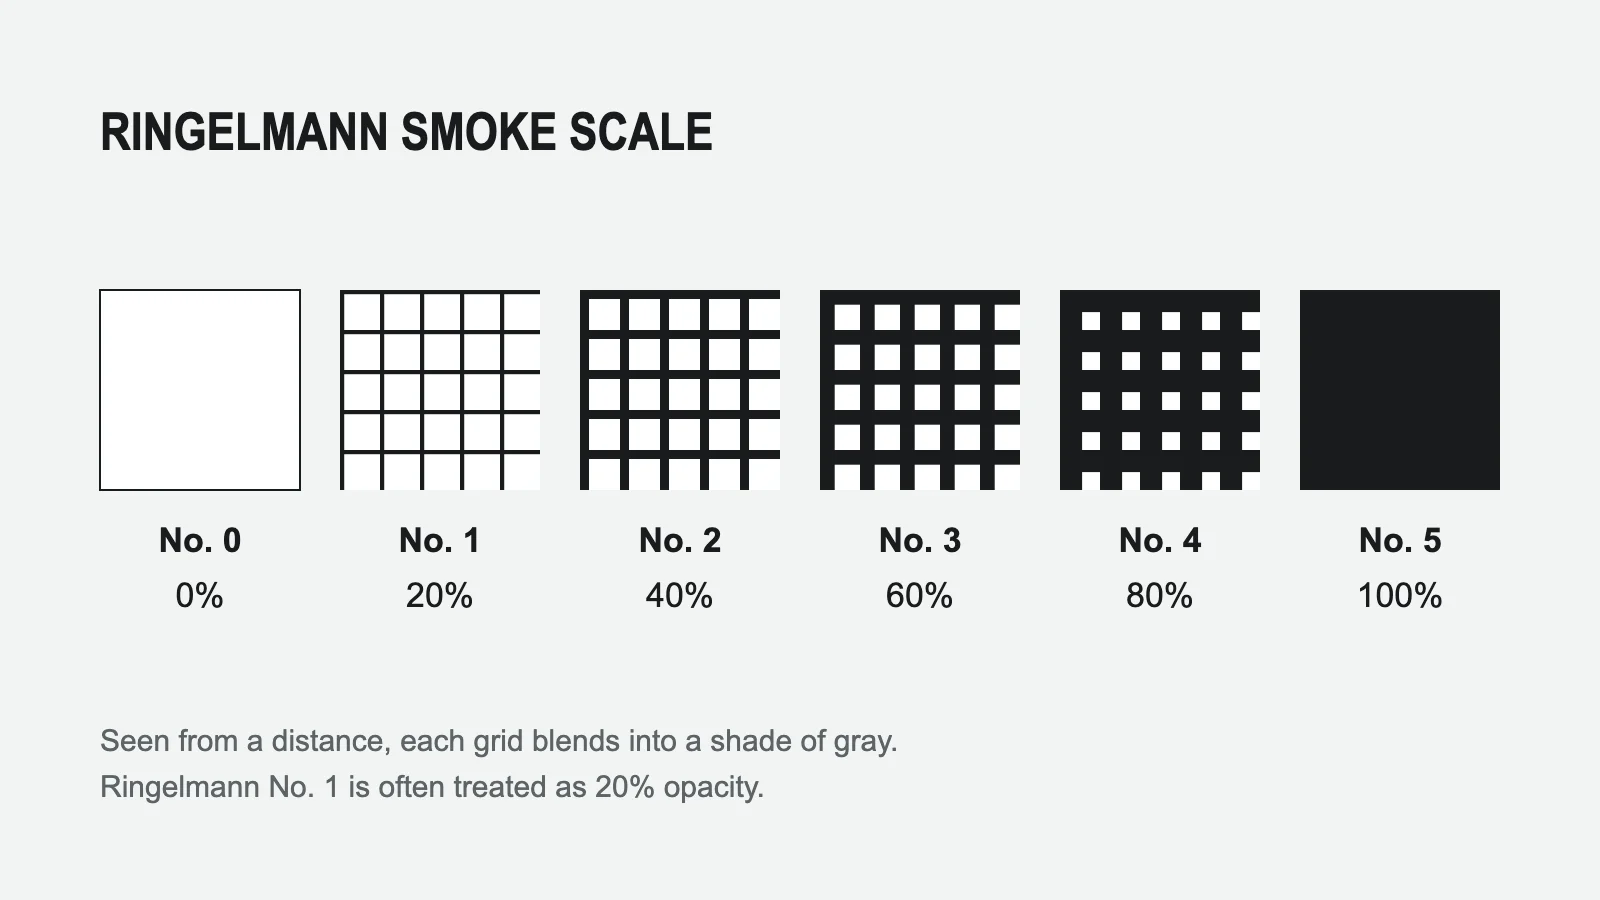
The chart has grids of black lines on white. Ringelmann No. 0 is all white, No. 1 is 20% black, No. 2 is 40%, No. 3 is 60%, No. 4 is 80% and No. 5 is solid black. Seen from a distance, each grid blends into a shade of gray.
How it was used
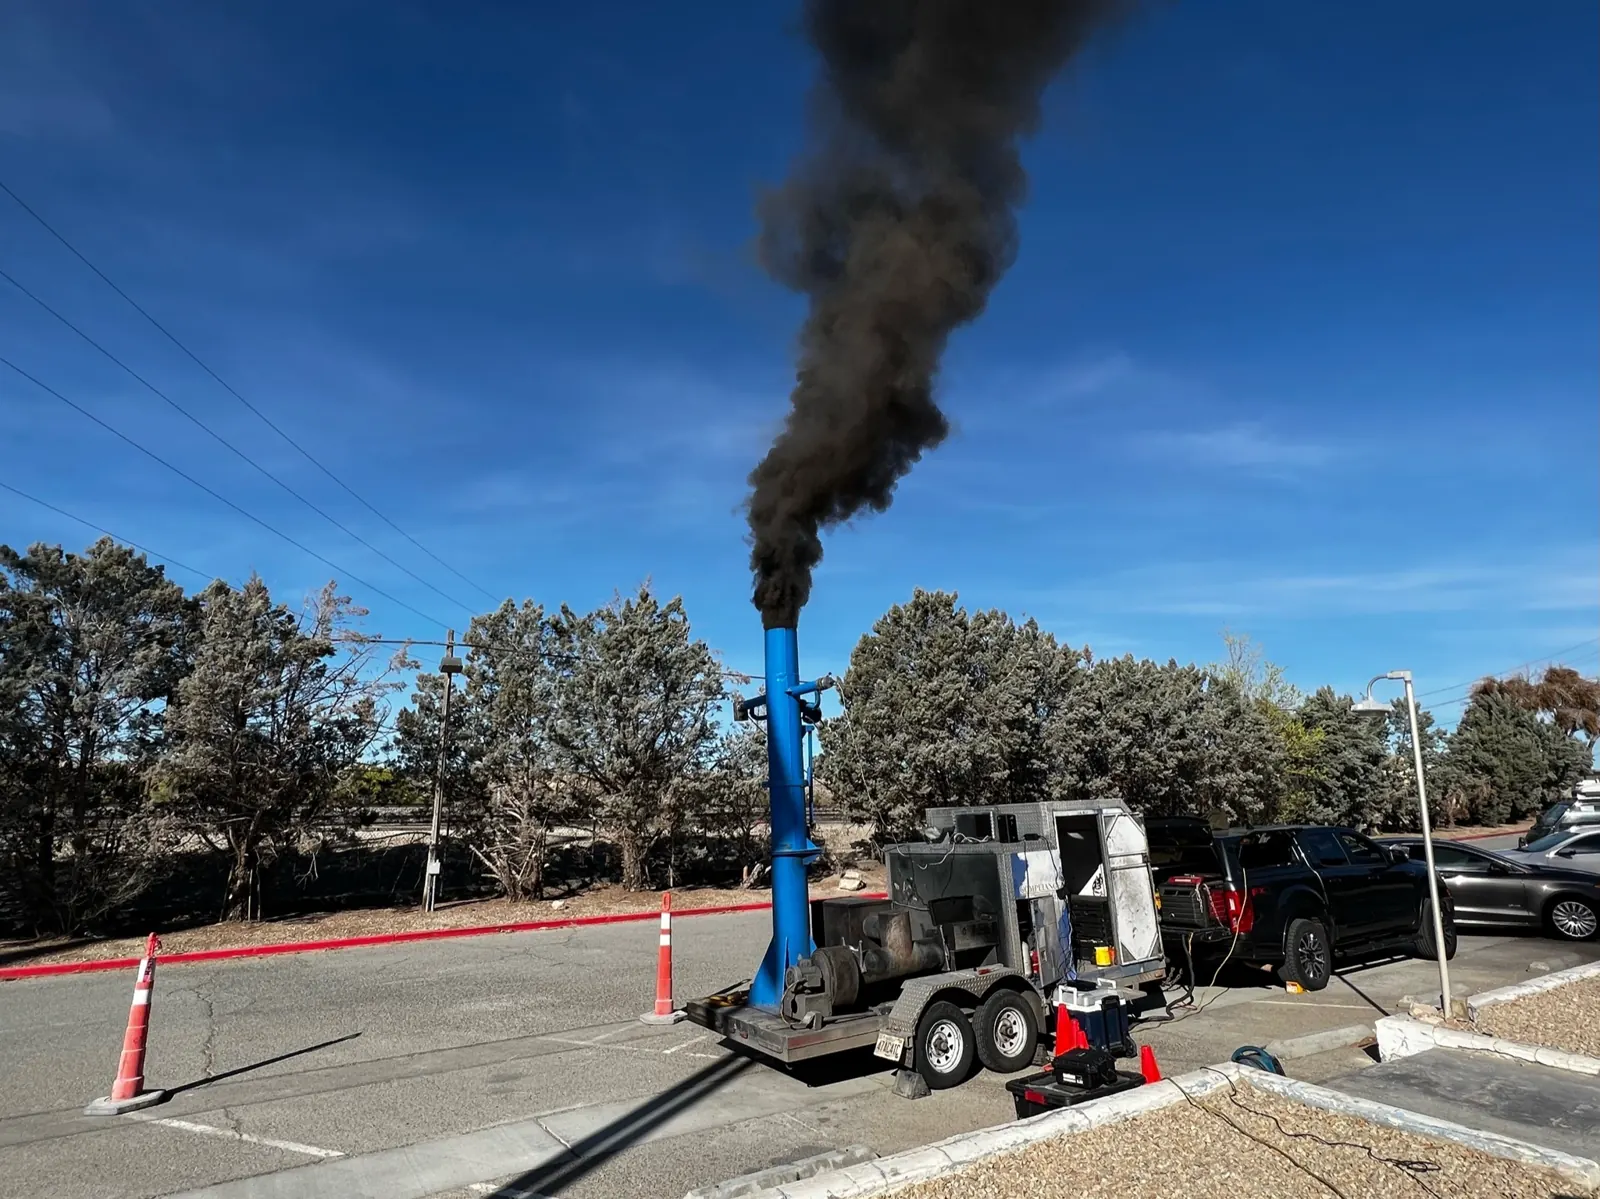
The observer held the chart at arm’s length or placed it at a distance and compared the darkness of the smoke with each grid. The closest match became the Ringelmann number.
Ringelmann vs Method 9
The chart only grades dark smoke and depends on the printed card. EPA Method 9 replaced it with trained, certified observers who read both black and white plumes as percent opacity. Ringelmann No. 1 is often treated as 20% opacity.